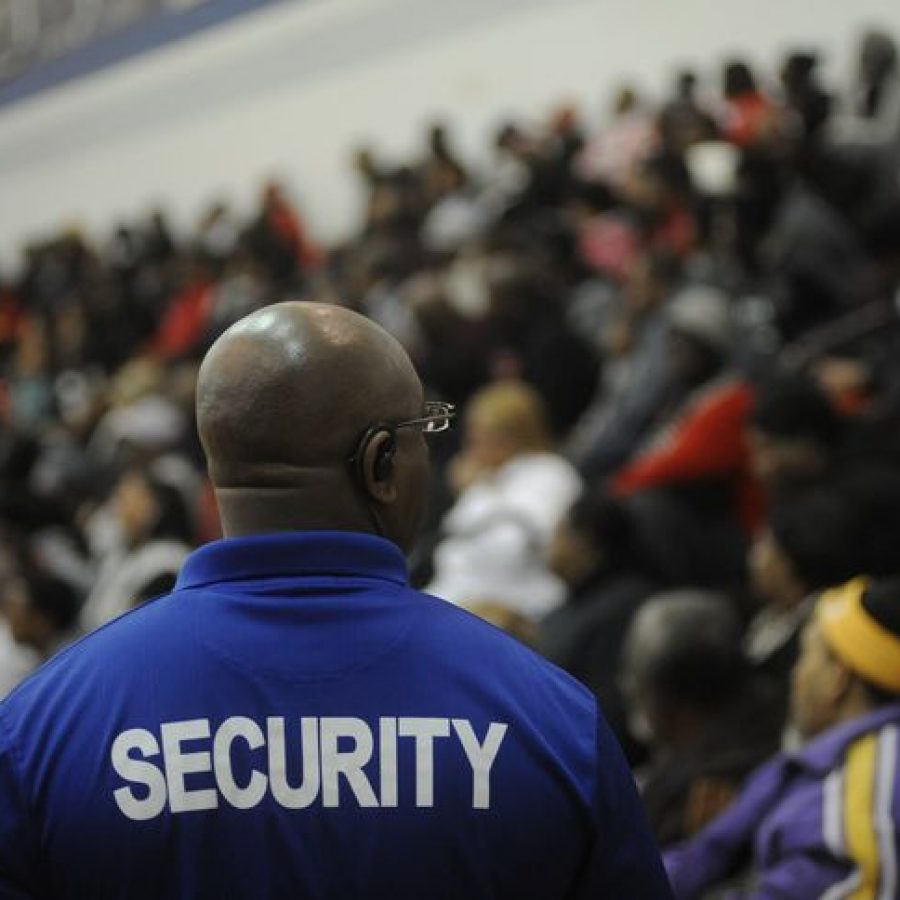
In suburban districts surrounding four major cities, counselors and social workers outnumber security.
In the Chicago Public Schools, where Dexter Leggins works and sends his children, students are more likely to encounter a security officer than a counselor or a social worker.
But according to data obtained by The 74, that’s not the case in districts like Naperville and New Trier Township that ring a city struggling with the highest number of shootings and homicides it’s seen in 20 years.
Leggins serves as a “peacekeeper” at a Chicago public school, facilitating its restorative justice program, an approach to discipline that stresses mediation and conflict resolution over punishment. Leggins said he’s seen school security officers escalate situations with students that should be handled by educators, sometimes ending with a student’s arrest.
“Counselors in schools [are] much better than having police in schools,” he said.
In an exclusive report last year, The 74 used data to show that the country’s 10 largest school districts — including New York City, Chicago, Miami-Dade, and Houston — employ more security than counselors. In Chicago, for instance, there are 1,065 counselors and social workers, compared with 1,379 security personnel.
But this lopsided ratio — where school personnel concerned with security and order outnumber those focused on students’ academic, social, and emotional issues — doesn’t hold true in many nearby suburbs.
The 74 filed public records requests with various school districts surrounding New York City and Chicago and in the Houston metropolitan areas, as well as the state of Florida. The 21 districts surveyed included mostly affluent, whiter enclaves as well as a handful of high-poverty suburban areas.
The data illustrate just how stark the differences are between the urban districts and their suburban neighbors. Across the four regions, all but one of the suburban districts surveyed employed more counselors and social workers combined than security.
The only outlier was the East Ramapo Central School District, a largely poor district north of New York City that has become known for having an elected school board controlled by members of the ultra-Orthodox Jewish community whose children attend private religious schools. The board and the administration have been heavily criticized in recent years for their budgeting and management policies.
But East Ramapo was the exception.
In Naperville Community Unit School District 203, about 30 miles west of Chicago — where about two in three students are white and fewer than one in five qualifies as low-income — there are more than twice as many counselors and social workers as security staff. Similar numbers hold in several other suburban Chicagoland districts as well.
This pattern wasn’t necessarily because the suburban districts had more counselors and social workers; sometimes, it was driven by the relatively large numbers of security personnel in city districts. For example, New York City and Miami-Dade generally had as many or slightly more counselors and social workers per student than the comparison districts, but many more security officers.
Houston, on the other hand, had far fewer counselors and social workers per student than the surrounding districts surveyed.
“We work with a lot of communities where young people are going to school with high security and a lack of counselors, and I think [the data] is very telling about what we’ve heard from communities across the country that there is not enough investment in social workers and counselors,” said Nancy Treviño of the Dignity in Schools Campaign, which advocates for reducing punitive approaches to school discipline.
Stark disparities
The 74’s data are in line with a national report showing that schools in cities, and schools serving large numbers of students of color or those in poverty, are significantly more likely to employ security staff than whiter, wealthier suburban districts. Even the nomenclature can change with the geography. In some well-to-do suburban districts, security personnel go by softer titles, like pupil personnel assistants or campus activity attendants.
The 74’s data come from a small sample of districts that may not be entirely representative of larger suburban areas. The information was collected over the course of several months last year, so it may not reflect more recent staffing changes.
The results are perhaps unsurprising, but they highlight stark disparities regarding the role of security in urban districts. Significant attention has recently been paid to law enforcement in schools: Federal data show that 1.6 million students attend a school that has security officers in the building but no counselors, and a number of videos have recorded school security officers engaging in violence against students.
Many of these officers receive limited training in dealing with children, especially those who may have cognitive or emotional disabilities and are more likely, data show, to be subjected to harsh discipline in school.
In September of last year, the U.S. Department of Education issued guidance on the deployment of officers in schools, stating that ordinary discipline problems should be handled by educators, not law enforcement. It is not clear whether that directive will be maintained by the Trump administration.
Jadine Chou, chief of safety and security at the Chicago Public Schools, said security staff can play a positive role in schools.
“Around the country there’s a paradigm that the presence of security officers inside a school must mean that there’s an increased focus on enforcements, arrests, actions like that,” she said. “At CPS … we [have] worked really hard to change this paradigm.”
She said that some students say security officers make them feel safe and pointed out that many of the district’s security personnel are themselves graduates of the city’s schools. They play a positive role in a school’s culture, building relationships with students, she said.
“We’ve overhauled [security officers’] job descriptions, we’ve overhauled the training, which we do regularly,” Chou said. “Every session with the security officers is [about] how do we make you more supportive and helpful to create a safe, supportive environment that’s welcoming to our students.”
Suspensions, expulsions, and police notifications are all down significantly in Chicago, according to Chou.
Research involving school security is limited, though one recent study found that the presence of security personnel in schools increased safety but also made it more likely that students, particularly those under the age of 15, would be arrested.
Advocates fear that such staff contribute to the school-to-prison pipeline, where students, particularly black males, who are more likely to be suspended and expelled, end up in the criminal justice system.
On the other hand, studies have consistently found that school counselors can have positive effects on student behavior and academic achievement. In addition to helping students navigate classes and peer relationships, counselors play a critical role in assisting students with college admissions, a need that is greater for poorer students of color who may be the first in their family to apply.
Suburbs vs. cities
The overarching trend is clear across four disparate geographic areas: While urban areas employed more security than counselors and social workers, the opposite was true in all but one of the 21 suburban areas for which The 74 collected data.
However, specifics of this pattern varied significantly from area to area. For instance, New York City has a comparable, and in some cases greater, number of counselors and social workers per student versus the five surrounding districts that were surveyed. However, the city had a significantly larger number of security personnel: about three or four times as many as some other districts.
One highly affluent Westchester County district, Scarsdale, doesn’t employ security at all.
Notably, New York City has launched an initiative to significantly expand the number of counselors and social workers in grades 6–12 in certain high-need areas such as the South Bronx and Brownsville, Brooklyn.
Source: Data compiled through public records requests, district spokespeople, and publicly available information.
Meanwhile, the Chicago Public Schools employ somewhat fewer counselors and social workers than most suburban districts examined. Glenbrook and New Trier — wealthy, largely white districts north of Chicago — have significantly more of all three (security, social workers, and counselors) per pupil. Those two districts, though, encompass only high schools, so the numbers may not be directly comparable to Chicago’s, since high schools generally have more counselors and security than elementary schools.
The only surveyed district in the area with fewer counselors and social workers per student than Chicago was District U-46 in Elgin, which serves largely students of color from low-income households. These results may be a reflection of funding disparities in the state. A report from the Education Law Center found that, on average, affluent school districts in Illinois spend significantly more money per student than high-poverty districts, $13,235 per pupil versus $10,176.
Chou, of Chicago Public Schools, said the key to evaluating a district is determining what role different staff members play in schools.
“This should not be a debate about security officers versus counselors,” she said. “What we’ve been able to do, and what school districts should do, is, let’s look at their individual roles and let’s look at what we can do to make the roles we do have in place as effective as possible.”
Source: Data compiled through public records requests, district spokespeople, and publicly available information.
In Florida, districts cover large geographical areas encompassing entire counties, so The 74 collected data on districts around the state to compare to Miami–Dade County Public Schools. Miami-Dade employs slightly more counselors and social workers per student than the four other Florida districts examined.
Miami-Dade also had substantially more security staff per student than the other surveyed Florida districts — often several times as many. A district spokesperson did not respond to a request for to comment.
Source: Data compiled through public records requests, district spokespeople, and publicly available information.
In the Houston area, the disparities are the most pronounced in terms of access to counselors and social workers. Though the Houston Independent School District generally had a similar number of security personnel as the five surrounding districts examined — a few less than a couple, a few more than others — the city’s schools have far fewer counselors and social workers.
All six surveyed districts had substantially more counselors and social workers than Houston, which has approximately one counselor or social worker per 1,000 students; the six surrounding districts generally had about twice as many counselors and social workers per student as Houston. The American School Counselor Association recommends one counselor for every 250 students.
Lila Hollin, a spokeswoman for the Houston schools, said the Houston Endowment last year awarded the district an $8.5 million grant to hire college access coordinators to help guide students through the college application.
“HISD is committed to ensuring that students have access to counseling services, whether that’s through a dedicated HISD counselor or a service plan as implemented by a campus professional,” Hollin said in email.
Hollin also noted, “Earlier this year, the HISD Board of Education explored increasing the number of counselors assigned to schools. However, that proposal was put on hold as a result of the impending loss of $162 million in HISD taxes because of the state’s school finance law.”
Source: Data compiled through public records requests, district spokespeople, and publicly available information.
Data Appendix
New York City Department of Education
Counselors: 2,902
Social workers: 1,275
Security: 5,200 (including 200 uniformed NYPD police officers)
Students: 984,130
Counselors: 2,902
Social workers: 1,275
Security: 5,200 (including 200 uniformed NYPD police officers)
Students: 984,130
- 76.5% qualify for free or reduced-price lunch
- 40.5% Hispanic, 27.1% black, 15.5% Asian, 14.8% white, 2.1% other
East Ramapo Central School District (Spring Valley)
Counselors: 15
Social workers: 0
Security: 29
Students: 8,517
Counselors: 15
Social workers: 0
Security: 29
Students: 8,517
- 79.2% qualify for free or reduced-price lunch
- 53% Hispanic, 37.1% black, 4.5% Asian, 4.4% white
Great Neck Public Schools
Counselors: 20
Social workers: 7
Security: 8
Students: 6,725
Counselors: 20
Social workers: 7
Security: 8
Students: 6,725
- 16.4% qualify for free or reduced-price lunch
- 52.2% white, 35.8% Asian, 8.7% Hispanic, 1.9% multiracial, 1.2% black
Greenwich (Connecticut) School District
Counselors: 27
Social workers: 10.6
Security: 13
Students: 8,680
Counselors: 27
Social workers: 10.6
Security: 13
Students: 8,680
- 15.4% qualify for free or reduced-price lunch
- 64.4% white, 20.5% Hispanic, 8.4% Asian, 3.8% multiracial, 2.8% black
Montclair (New Jersey) Public Schools
Counselors: 24
Social workers: 6
Security: 12
Students: 6,691
Counselors: 24
Social workers: 6
Security: 12
Students: 6,691
- 16% qualify for free or reduced-price lunch
- 50.4% white, 27.7% black, 11.4% Hispanic, 5.7% Asian, 4.7% multiracial
Scarsdale Union Free School District
Counselors: 12.3
Social workers: 0
Security: 0
Students: 4,808
Counselors: 12.3
Social workers: 0
Security: 0
Students: 4,808
- 0% qualify for free or reduced-price lunch (does not offer federally subsidized lunches)
- 68.4% white, 18.1% Asian, 6.5% Hispanic, 5.7% multiracial, 1.1% black
Chicago Public Schools
Counselors: 736
Social workers: 320
Security: 1,416
Students: 336,138
Counselors: 736
Social workers: 320
Security: 1,416
Students: 336,138
- 86% qualify for free or reduced-price lunch
- 45.6% Hispanic, 39.3% black, 9.4% white, 3.6% Asian, 1.1% multiracial
Aurora East Unit School District 131
Counselors: 23
Social workers: 31
Security: 32
Students: 14,799
Counselors: 23
Social workers: 31
Security: 32
Students: 14,799
- 81.6% qualify for free or reduced-price lunch
- 86.1% Hispanic, 7.9% black, 3.4% white, 1.4% multiracial
Barrington Community Unit School District 220
Counselors: 19
Social workers: 10
Security staff: 16 (1 police liaison officer)
Students: 8,879
Counselors: 19
Social workers: 10
Security staff: 16 (1 police liaison officer)
Students: 8,879
- 22% qualify for free or reduced-price lunch
- 67.7% white, 17.7% Hispanic, 12.5% Asian, 2.1% black
Glenbrook High School District 225 (Glenview)
Counselors: 24
Social workers: 11
Security staff: 33
Students: 5,063
Counselors: 24
Social workers: 11
Security staff: 33
Students: 5,063
- 15.8% qualify for free or reduced-price lunch
- 69.3% white, 16.9% Asian, 8.9% Hispanic, 3.5% multiracial, 1.2% black
Naperville Community Unit School District 203
Counselors: 36
Social workers: 31
Security: 26
Students: 16,917
Counselors: 36
Social workers: 31
Security: 26
Students: 16,917
- 17.6% qualify for free or reduced-price lunch
- 65.7% white, 15.4% Asian, 9.7% Hispanic, 4.9% black, 4.1% multiracial
New Trier Township High School District 203 (Winnetka)
Counselors: 53.6
Social workers: 31
Security: 34
Students: 3,992
Counselors: 53.6
Social workers: 31
Security: 34
Students: 3,992
- 3.9% qualify for free or reduced-price lunch
- 85.3% white, 7.4% Asian, 3.9% Hispanic, 2.7% multiracial
School District U-46 (Elgin)
Counselors: 38
Social workers: 62
Security staff: 60
Students: 40,400
Counselors: 38
Social workers: 62
Security staff: 60
Students: 40,400
- 57.8% qualify for free or reduced-price lunch
- 50.8% Hispanic, 29.9% white, 8.5% Asian, 6.5% black, 3% multiracial, 1.2% American Indian
Miami–Dade (Florida) County Public Schools
Counselors: 743
Social workers: 144
Security: 1,839 (189 police officers)
Students: 291,379
Counselors: 743
Social workers: 144
Security: 1,839 (189 police officers)
Students: 291,379
- 77% qualify for free or reduced-price lunch
- 69% Hispanic, 22% black, 7% white
Clay County
Counselors: 87
Social workers: 12
Security: 8
Students: 41,440
Counselors: 87
Social workers: 12
Security: 8
Students: 41,440
- 43% qualify for free or reduced-price lunch
- 67% white, 14% black, 10% Hispanic, 5% multiracial, 3% Asian
Sarasota County Schools
Counselors: 81
Social workers: 12
Security: 60
Students: 36,294
Counselors: 81
Social workers: 12
Security: 60
Students: 36,294
- 51% qualify for free or reduced-price lunch
- 64.9% white, 19% Hispanic, 8.6% black, 4.5% multiracial, 2.5% Asian
Seminole County Public Schools
Counselors: 141
Social workers: 19
Security: 78
Students: 65,037
Counselors: 141
Social workers: 19
Security: 78
Students: 65,037
- 53% qualify for free or reduced-price lunch
- 52.1% white, 24.8% Hispanic, 14.5% black, 3.5% multiracial
St. Johns County School District
Counselors: 73
Social workers: 9
Security: 12 (St. Johns County sheriff’s deputies)
Students: 37,997
Counselors: 73
Social workers: 9
Security: 12 (St. Johns County sheriff’s deputies)
Students: 37,997
- 24% qualify for free or reduced-price lunch
- 73% white, 7.3% black, 6.8% Hispanic, 5.6% unreported, 3.8% Asian, 2.7% multiracial
Houston Independent School District
Counselors: 167 counselors
Social workers: 32 social workers
Security staff: 250 (210 classified police officers)
Students: 196,375
Counselors: 167 counselors
Social workers: 32 social workers
Security staff: 250 (210 classified police officers)
Students: 196,375
- 76.4% qualify for free or reduced-price lunch
- 62.1% Hispanic, 24.5% black, 8.5% white, 3.8% Asian, 1% multiracial
Aldine Independent School District (Houston)
Counselors: 170
Social workers: 10
Security staff: 62 (50 police officers)
Students: 70,424
Counselors: 170
Social workers: 10
Security staff: 62 (50 police officers)
Students: 70,424
- 88.3% qualify for free or reduced-price lunch
- 72.2% Hispanic, 23.8% black, 1.9% white, 1.3% Asian
Clear Creek Independent School District (League City)
Counselors: 86
Social workers: 9
Security staff: 26
Students: 40,640
Counselors: 86
Social workers: 9
Security staff: 26
Students: 40,640
- 27% qualify for free or reduced-price lunch
- 49.3% white, 28.7% Hispanic, 9.8% Asian, 8.1% black, 3.8% multiracial
Katy Independent School District
Counselors: 126
Social workers: 1
Security staff: 109
Students: 73,713
Counselors: 126
Social workers: 1
Security staff: 109
Students: 73,713
- 29.5% qualify for free or reduced-price lunch
- 37.9% white, 33.4% Hispanic, 14.2% Asian, 9.9% black, 4.2% multiracial
Montgomery Independent School District
Counselors: 17
Social workers: 0
Security staff: 5
Students: 8,174
Counselors: 17
Social workers: 0
Security staff: 5
Students: 8,174
- 23.5% qualify for free or reduced-price lunch
- 79.3% white, 13.9% Hispanic, 3% black, 2% multiracial
Pearland Independent School District
Counselors: 44
Social workers: 0
Security staff: 39 (10 SROs and 29 contracted security officers)
Students: 21,106
Counselors: 44
Social workers: 0
Security staff: 39 (10 SROs and 29 contracted security officers)
Students: 21,106
- 28.2% qualify for free or reduced-price lunch
- 37.6% white, 30.3% Hispanic, 15.4% black, 10.2% Asian, 2.8% multiracial
Royal Independent School District (Pattison)
Counselors: 5
Social workers: 0
Security staff: 3
Students: 2,270
Counselors: 5
Social workers: 0
Security staff: 3
Students: 2,270
- 76% qualify for free or reduced-price lunch
- 71.5% Hispanic, 16.7% black, 10% white, 1.7% multiracial


